Structural Analysis of Adaptive Logic Systems
Abstract: This document serves as a stress test for the Citadel rendering engine. It demonstrates the visual hierarchy, code syntax highlighting, and typographical capabilities of the system. The objective is to verify that the "Infiltration" aesthetic holds up under dense technical information.
1. Introduction to the Protocol
The primary constraint of modern educational architecture is not the availability of data, but the structural integrity of the delivery mechanism. As noted by [Saric, 2025], linear models fail when applied to non-linear cognitive maps.
- List Item 1
- List Item 2
- List Item 3
- List Item 4
- List Item 5
1.1 The Core Hypothesis
We propose a system where the "Curriculum" is not a static list, but a dynamic graph. 1. Node A: Assessment of current state. 2. Node B: Identification of friction points. 3. Node C: Dynamic resource allocation.
"The function of the Architect is not to decorate the facade, but to ensure the load-bearing walls do not collapse under the weight of the user's ambition." — System Logs, Vol 1.
2. Computational Methods
To visualize this, we utilize a recursive feedback loop. Below is the standard Python implementation used in our lab.
2.1 The Python Engine
Notice how the syntax highlighting differentiates between classes, functions, and strings.
class CognitiveModel:
    def __init__(self, friction_coefficient=0.5):
        self.friction = friction_coefficient
        self.state = "DORMANT"

    def analyze(self, data_stream):
        """
        Parses input to detect structural weakness.
        """
        if len(data_stream) > 1000:
            self.state = "OVERLOAD"
            return self._mitigate_risk()

        return "STABLE"

    def _mitigate_risk(self):
        # Recursive damping
        return self.friction * 0.9
2.2 The R Statistics Block
For data analysis, we rely on vectorised operations.
library(ggplot2)

# Simulate User Load
data <- data.frame(
  time = 1:100,
  load = cumsum(rnorm(100))
)

# Plot the structural stress
ggplot(data, aes(x=time, y=load)) +
  geom_line(color="#004488") +
  theme_minimal() +
  ggtitle("System Stress Over Time")
3. Typographical Stress Test
3.1 Lists and Nesting
We often need to categorize data into hierarchies. * Level 1: The Infrastructure * Server Hardware (Hetzner) * Operating System (Ubuntu) * Level 2: The Application * Flask Engine * Markdown Parser * Feature: Table of Contents * Feature: CodeHilite
3.2 Emphasis and Linking
- Bold: Used for core concepts.
- Italic: Used for variable names or emphasis.
Code Inline: Used for file paths like/content/publications/.- Hyperlinks: Used to cite external sources (Standard Style).
4. Tabular Data (ASCII Fallback) and Images
Note: Since we are using a lightweight engine, we use ASCII tables for maximum compatibility and "Terminal" aesthetic.
| Metric        | Value      | Status  |
|---------------|------------|---------|
| CPU Load      | 12%        | OPTIMAL |
| Memory        | 512MB      | STABLE  |
| Latency       | 45ms       | GOOD    |
A HTML Table
| Metric | Value |
|---|---|
| CPU | 12% |
| RAM | 8GB |
Here is the image example:
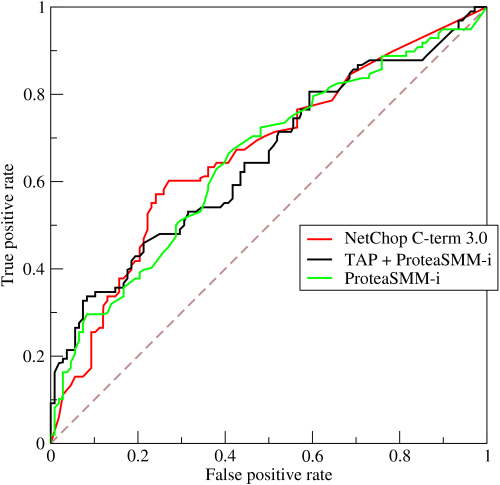
Figure 1: Analysis of load-bearing constraints.
5. Conclusion
The system is nominal. The typography (Serif for body, Sans for headers) creates the necessary contrast for deep reading.